前言 :
NetworkX is a Python language software package for the creation, manipulation, and study of the structure, dynamics, and functions of complex networks. It provides features as below (下載 Packages) :
建立 graph :
底下代碼建立一個空 graph (沒有 node, edge) :
By definition, a Graph is a collection of nodes (vertices) along with identified pairs of nodes (called edges, links, etc). In NetworkX, nodes can be any hashable object e.g. a text string, an image, an XML object, another Graph, a customized node object, etc. (Note: Python’s None object should not be used as a node as it determines whether optional function arguments have been assigned in many functions.)
Nodes :
The graph G can be grown in several ways. NetworkX includes many graph generator functions and facilities to read and write graphs in many formats. To get started though we’ll look at simple manipulations. You can add one node at a time :
add a list of nodes :
or add any nbunch of nodes. An nbunch is any iterable container of nodes that is not itself a node in the graph. (e.g. a list, set, graph, file, etc..)
Note that G now contains the nodes of H as nodes of G. In contrast, you could use the graph H as a node in G :
The graph G now contains H as a node. This flexibility is very powerful as it allows graphs of graphs, graphs of files, graphs of functions and much more. It is worth thinking about how to structure your application so that the nodes are useful entities. Of course you can always use a unique identifier in G and have a separate dictionary keyed by identifier to the node information if you prefer. (Note: You should not change the node object if the hash depends on its contents.)
Edges :
Graph 可以如下一次添加一個 edge :
或是如下一次添加多個 edges :
另外你也可以透過 ebunch 的方式添加 edges. 在使用 tuple 表示 edge 時, 可以在 tuple 第三個位置上擺放該 edge 的屬性, 如 (2,3,{‘weight’:3.1415}). 底下為使用 ebunch 添加 edges :
如果你要移除 edges/nodes, 可以使用方法 : Graph.remove_node(), Graph.remove_nodes_from(), Graph.remove_edge() and Graph.remove_edges_from(), e.g
如果你要移除所有的 node/edge, 則可以 :
如果你添加重複的 node/edge 不會出現 Exception, 你可以透過方法知道目前 Graph 共有幾個 edge/node :
底下是 Graph 部分提供方法的使用 :
底下是一些移除 node/edge 的使用示範 :
Accessing edges :
你可以將 Graph 當作 list 去 access 裡面的 nodes, edges (但千萬別修改返回的內容, 會造成 Graph inconsistent) :
你可以使用 dict 的方法去為 node/edge 添加屬性 :
除了使用上面方法去操作 node/edge, 你也可以透過方法 adjacency_iter() 來拜訪某個 Graph 的所有 node :

Adding attributes to graphs, nodes, and edges :
你可以在 Graph 中的 edge/node 甚至是 Graph 本身添加屬性, 而屬性可以是任何物件. 屬性則以 dict 的形式存放在.
- Graph attributes
底下為新增的 Graph 添加/修改屬性 :
- Node attributes
底下示範如何對 node 的屬性進行操作 :
Ps. 如果你手動添加 node 到 G.node, 並不會添加到 Graph, 所以請用方法 G.add_node() etc 進行 node 的添加.
- Edge Attributes
底下示範對 edge 的屬性進行操作 :
Directed graphs :
透過類別 DiGraph 可以達成有方向性的 Graph 相關操作. 相關方法如 DiGraph.out_edges(), DiGraph.in_degree(), DiGraph.predecessors() 與 DiGraph.successors() 等. 底下我們來看看簡單使用操作 :
另外如果你要將有向 Graph 轉為無方向的 Graph, 可以如下操作 :
Multigraphs :
如果你的 Graph 兩點間的 edge 是沒有數量限制的, 則可以考慮使用 MultiGraph 與 MultiDiGraph. 底下是現有 NetworkX 支援 Graph 的分類 :

接著來看看使用範例 :

Drawing graphs :
NetworkX 提供繪圖的 APIs, 詳細使用可以參考 Drawing. 但在使用這些繪圖 APIs 前, 你必須安裝另外的 library 為 Matplotlib (Matplotlib 安裝說明請參考 這裡). 底下我們來看簡單範例 :
首先匯入 Matplotlib 的 plot 介面 :
接著透過 NetworkX 的 draw() 函式呼叫 Matplotlib 繪圖 :

或者你可以另存繪圖結果為圖片檔 :
Practice in Algorithm implementation :
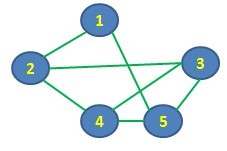
透過 NetworkX 的幫助, 我們便可以很輕鬆地寫出圖形理論相關的演算法, 底下代碼為實現 DFS (Deep First Search) 節點訪問的演算法 :
- 範例圖形 :

- 範例代碼 :
- import networkx as nx
- G = nx.Graph()
- G.add_edges_from([(1,5), (1,2), (2,3), (2,4), (3,4), (3,5), (4,5), (5,3)])
- stack = [1] # Start from node1
- visit_list = []
- while len(stack) > 0:
- #nonlocal visit_list
- #nonlocal stack
- vnode = stack.pop()
- if vnode not in visit_list:
- print("\t[Info] Visit {0}...".format(vnode))
- visit_list.append(vnode)
- nbs = G.neighbors(vnode)
- for nb in nbs:
- if nb not in visit_list:
- print("\t[Info] Put {0} in stack...".format(nb))
- stack.append(nb)
- print("\tStack list={0}".format(stack))
- print("\tVisit list={0}".format(visit_list))
- if len(visit_list) == len(G.nodes()): break
- print("\t[Info] Deep First Search has {0}".format(visit_list))

Supplement :
* matplotlib : A python 2D plotting library
* stackoverflow : generating a PNG with matplotlib when DISPLAY is undefined


寫得很清楚,感謝版主教學
回覆刪除You are welcome!
刪除