2012年6月26日 星期二

[ Google Charts ] Visualization: Geochart tools

來源自 這裡 
Preface : 
因為需要對 Geography 的數據進行 Visualization 的顯示, 就 Google 到 Google chart tools, 在這裡有提供的 Charts 種類可以在 Chart Gallery 中找到許多實用的範例. 這邊我要介紹的是 Geo chart. 而為了 Integration 需求也寫了一個簡單的 Console mode 工具讓我快速的將自訂義的 data 使用 Geo chart 顯示. 

Overview of Geochart : 
Geochart 提供你方便將 Regional 的數據用色彩在 Geochart 上面顯示, 這樣可以一目了然的知道整個 Geography 的數據分布. 而這邊提供了兩種顯示模式 : 
* The region mode colorizes whole regions, such as countries, provinces, or states.
* The marker mode marks designated regions using bubbles that are scaled according to a value that you specify.

底下會使用範例說明這兩種模式的使用與差別. 

Example : 
- Regions Example 
在 Region 模式, 你可以將對應到 Region, Country 的數據在 Geography 使用顏色的漸層顯示出差距, 範例圖如下 : 
 

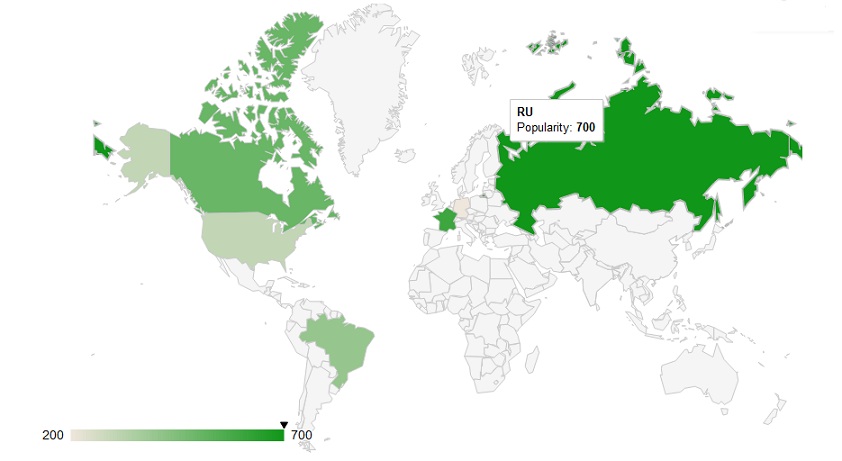
而上面圖例所需要的代碼相當少, 基本上你只要將你自己的數據 mapping 到下面代碼的 var data 即可以很方便的使用 Geochart 這樣的工具 : 


- Markers Example 
Marker 模式則是以 Bubble chart 的形式取代 Region 模式 將整個 Region/Country 塗上同一顏色的做法. 這樣的作法好處是你可以同時表達兩種意涵在裡面. 以下面的例子就是使用 Bubble chart 的大小表示 'Area' 的大小; 而以顏色的漸層表示 'Population' 的多寡 (越多越靠近藍色.). 範例圖示如下 : 
 

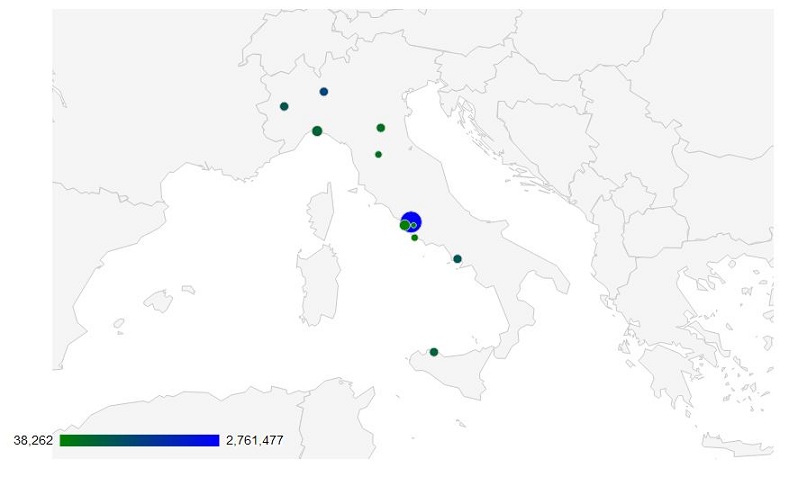
而這邊用來切換 Region 模式與 Marker 模式是在 options 中指定 (預設是 region) : 
  1. var options = {  
  2.         region: 'IT',  
  3.         displayMode: 'markers',  
  4.         colorAxis: {colors: ['green''blue']}  
  5.       };  
最後再進行 drawing 時將該 options 傳入 : 
  1. var chart = new google.visualization.GeoChart(document.getElementById('chart_div'));  
  2. chart.draw(data, options);  
完整代碼如下 : 


Data Format : 
完整的 Data format 說明可以在 這裡 得到更詳細說明. 這邊只整理一些常用的部分. 
- Regions mode format 
在上面 Region 模式代碼中傳入的資料有兩攔, 說明如下 : 
1. Region location [String, Required] 
A region to highlight. All of following formats are accepted. You can use different formats in different rows:
* A country name as a string (for example, "England"), or an uppercase ISO-3166-1 code or its English text equivalent (for example, "GB" or "United Kingdom").
* An uppercase ISO-3166-2 region code name or its English text equivalent (for example, "US-NJ" or "New Jersey").
* A metropolitan area code. These are three-digit metro codes used to designate various regions; US codes only supported. Note that these are not the same as telephone area codes.
* Any value supported by the region property.

2. Region color [Number, Optional] 
An optional numeric column used to assign a color to this region, based on the scale specified in the colorAxis.colors property. If this column is not present, all regions will be the same color. If the column is present, null values are not allowed. Values are scaled relative to the sizeAxis.minValue/sizeAxis.maxValue values, or to the values specified in the colorAxis.values property, if provided.

- Markers mode format 
在 Marker 模式會用到三欄資料, 前兩欄與 Region 模式相同, 但三欄決定 Bubble 的大小 : 
3. Marker size [Number, Optional] 
An optional numeric column used to assign the marker size, relative to the other marker sizes. If this column is not present, the value from the previous column will be used (or default size, if no color column is provided as well). If the column is present, null values are not allowed.

Geogen Tool : 
基於上面的說明, 如果要使用這樣功能, 最簡單的方法便是將代碼複製下來, 然後修改 data 成自己需要的數據 ; 接著存成 HTML page 再執行它, 便可以得到需要的 Geo Chart. 然而對常常需要變更 data 的狀況下, 每次都需要去修改 page 然後重新點擊執行有點繁瑣. 因此我撰寫了 Geogen 這個簡單的工具讓你將 data 與 page 耦合移除. 這裡我將原先的 HTML 代碼改成如下(region 模式) : 
- format.html : 


這邊的 data   會去讀取 data.txt 並將之傳換成對應 script 代碼, 而這邊的範例 data.txt 內容如下 : 
- data.txt : 
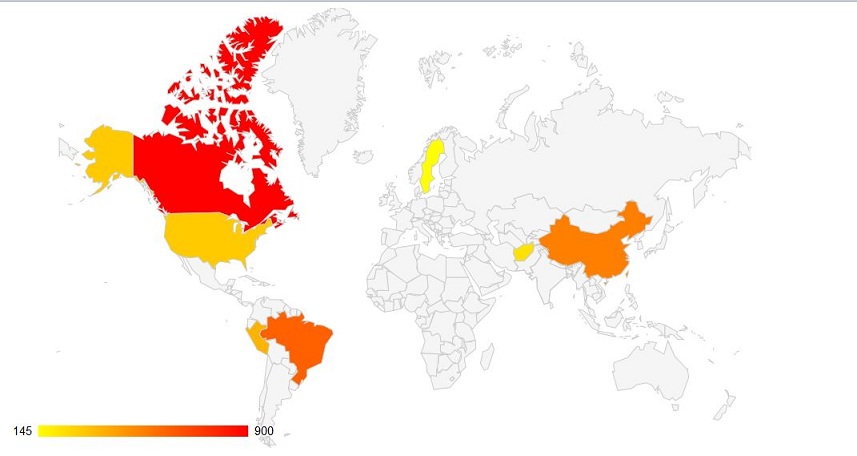
  1. # Format -> Country/Region : Number  
  2. # Country must satisfy ISO-3166_1 : http://en.wikipedia.org/wiki/ISO_3166-1  
  3. Germany : 200  
  4. United States : 300  
  5. Brazil : 400  
  6. TW : 446  
  7. China : 521  
  8. Canada : 900  
  9. Brazil : 612  
  10. AFGHANISTAN : 232  
  11. SE : 145  
  12. PE : 367  
在 format.html 中的 options  則會去讀取 config.txt 並將設定替換對應 script, 目前只支援 Color, Size, Region. 範例 config.txt 如下 : 
- config.txt : 
  1. Color:yellow, red  
  2. Size:980550  
  3. Region:world  
在 config.txt 中的 Size 會替換 format.html 中的  而改變產生的 Geochart 的大小. 最後要執行 Geogen 有一個已經寫好的 batch -> run.bat. 在該 batch 檔會使用 Geogen.jar 對剛剛介紹的檔案進行解析並依據 format.html 定義的格式導出 geo.html (該 page 會使用 data.txt 的數據, config.txt 的設定來產生 Geochart) 執行結果如下 : 
 

Geogen 工具可以在 這裡下載, 詳細檔案說明可以參考下載檔中的 Readme.TXT.

沒有留言:

張貼留言

[Git 常見問題] error: The following untracked working tree files would be overwritten by merge

  Source From  Here 方案1: // x -----删除忽略文件已经对 git 来说不识别的文件 // d -----删除未被添加到 git 的路径中的文件 // f -----强制运行 #   git clean -d -fx 方案2: 今天在服务器上  gi...