Source From Here
Network monitoring on Linux
This post mentions some linux command line tools that can be used to monitor the network usage. These tools monitor the traffic flowing through network interfaces and measure the speed at which data is currently being transferred. Incoming and outgoing traffic is shown separately.
Some of the commands, show the bandwidth used by individual processes. This makes it easy to detect a process that is overusing network bandwidth. The tools have different mechanisms of generating the traffic report. Some of the tools like nload read the "/proc/net/dev" file to get traffic stats, whereas some tools use the pcap library to capture all packets and then calculate the total size to estimate the traffic load.
Here is a list of the commands, sorted by their features.
Nload
nload is a commandline tool that allows users to monitor the incoming and outgoing traffic separately. It also draws out a graph to indicate the same, the scale of which can be adjusted. Easy and simple to use, and does not support many options.
iftop
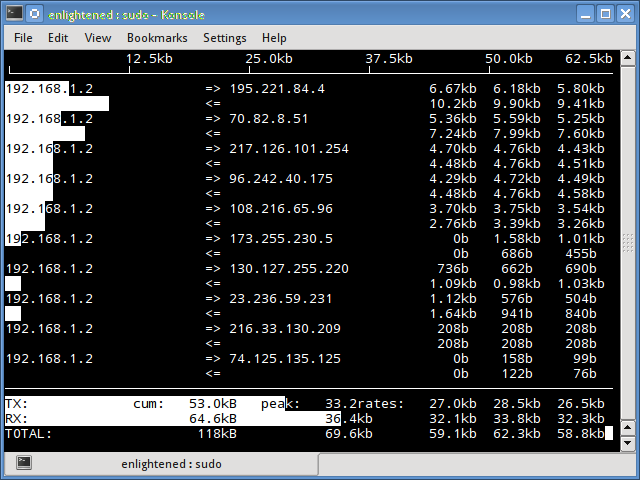
Iftop measures the data flowing through individual socket connections, and it works in a manner that is different from Nload. Iftop uses the pcap library to capture the packets moving in and out of the network adapter, and then sums up the size and count to find the total bandwidth under use.
Although iftop reports the bandwidth used by individual connections, it cannot report the process name/id involved in the particular socket connection. But being based on the pcap library, iftop is able to filter the traffic and report bandwidth usage over selected host connections as specified by the filter.
iptraf
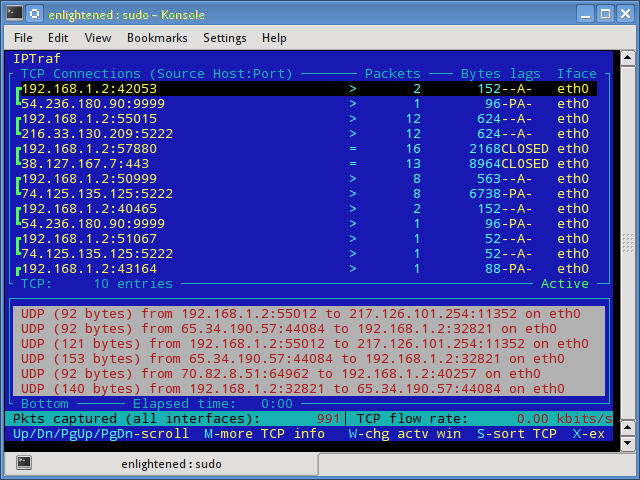
Iptraf is an interactive and colorful IP Lan monitor. It shows individual connections and the amount of data flowing between the hosts. Here is a screenshot
nethogs
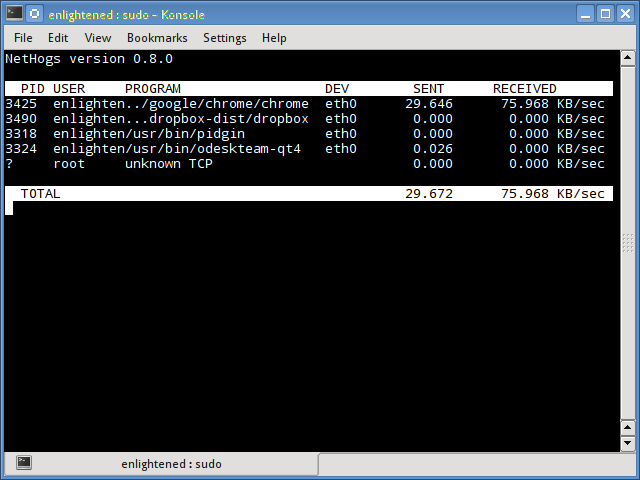
Nethogs is a small 'net top' tool that shows the bandwidth used by individual processes and sorts the list putting the most intensive processes on top. In the event of a sudden bandwidth spike, quickly open nethogs and find the process responsible. Nethogs reports the PID, user and the path of the program.
bmon
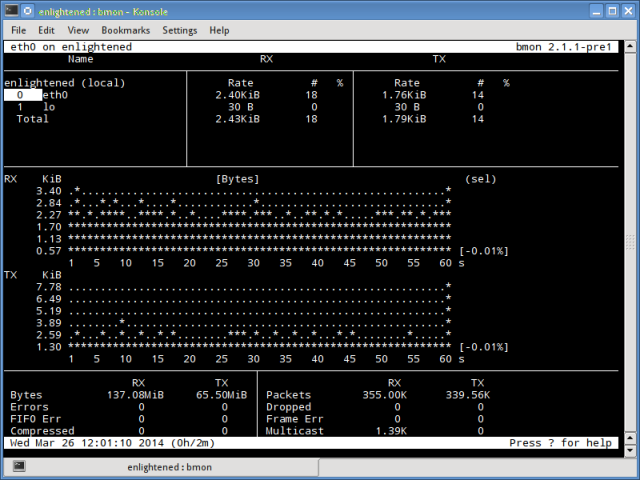
Bmon (Bandwidth Monitor) is a tool similar to nload that shows the traffic load over all the network interfaces on the system. The output also consists of a graph and a section with packet level details.
slurm
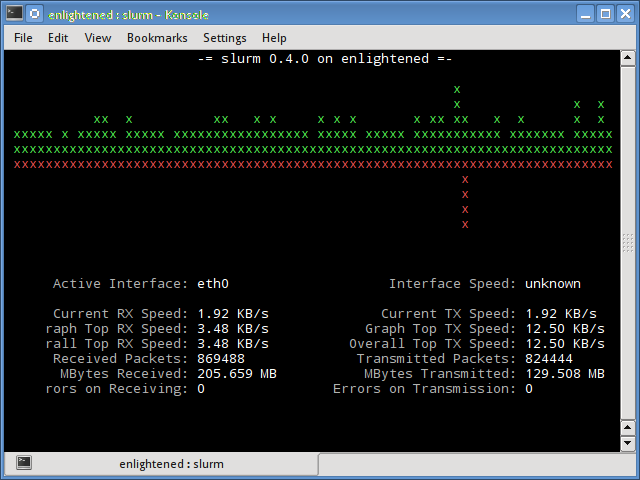
Slurm is 'yet' another network load monitor that shows device statistics along with an ascii graph. It supports 3 different styles of graphs each of which can be activated using the c, s and l keys. Simple in features, slurm does not display any further details about the network load.
tcptrack
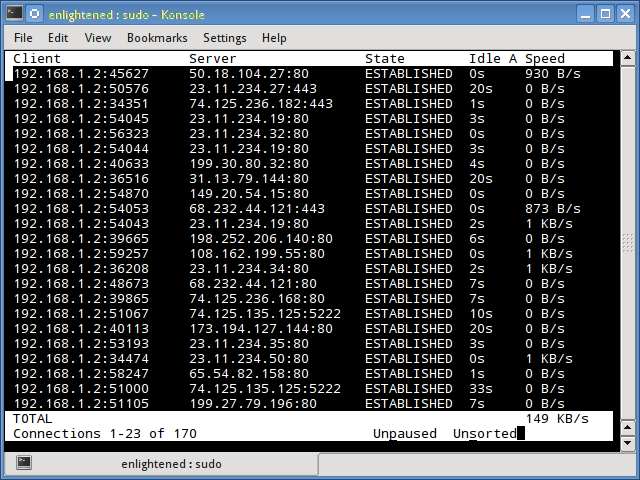
Tcptrack is similar to iftop, and uses the pcap library to capture packets and calculate various statistics like the bandwidth used in each connection. It also supports the standard pcap filters that can be used to monitor specific connections.
Vnstat
Vnstat is bit different from most of the other tools. It actually runs a background service/daemon and keeps recording the size of data transfer all the time. Next it can be used to generate a report of the history of network usage.
Running vnstat without any options would simply show the total amount of data transfer that took place since the date the daemon is running.

To monitor the bandwidth usage in realtime, use the '-l' option (live mode). It would then show the total bandwidth used by incoming and outgoing data, but in a very precise manner without any internal details about host connections or processes.

Vnstat is more like a tool to get historic reports of how much bandwidth is used everyday or over the past month. It is not strictly a tool for monitoring the network in real time.
bwm-ng
Bwm-ng (Bandwidth Monitor Next Generation) is another very simple real time network load monitor that reports a summary of the speed at which data is being transferred in and out of all available network interfaces on the system.
cbm - Color Bandwidth Meter
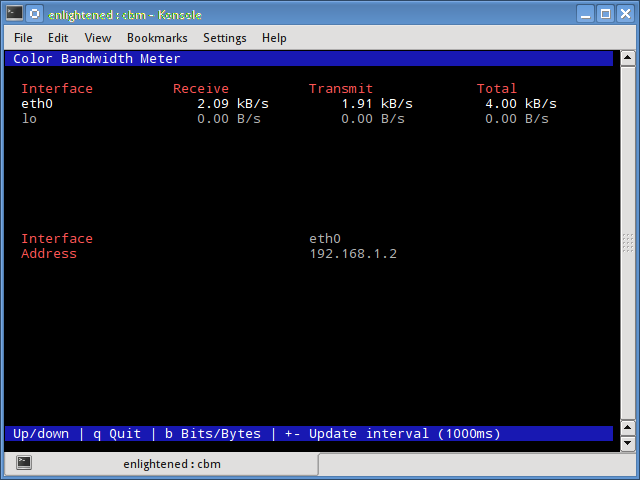
A tiny little simple bandwidth monitor that displays the traffic volume through network interfaces. No further options, just the traffic stats are display and updated in realtime.
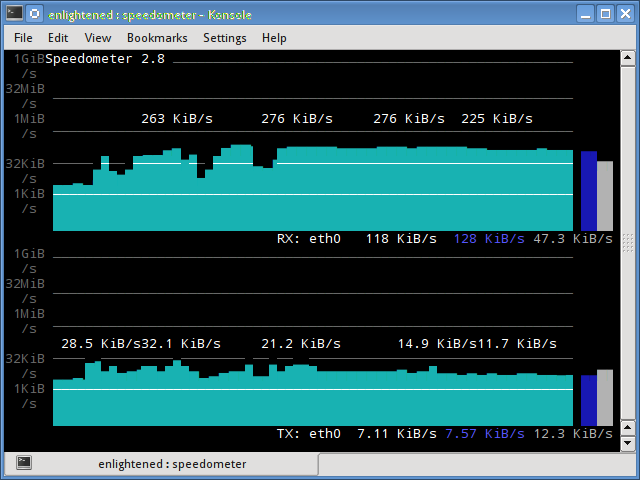
speedometer
Another small and simple tool that just draws out good looking graphs of incoming and outgoing traffic through a given interface.
Pktstat
Pktstat displays all the active connections in real time, and the speed at which data is being transferred through them. It also displays the type of the connection, i.e. tcp or udp and also details about http requests if involved.
Netwatch
Netwatch is part of the netdiag collection of tools, and it too displays the connections between local host and other remote hosts, and the speed at which data is transferring on each connection.
Trafshow
Like netwatch and pktstat, trafshow reports the current active connections, their protocol and the data transfer speed on each connection. It can filter out connections using pcap type filters. Monitor only tcp connections
Netload
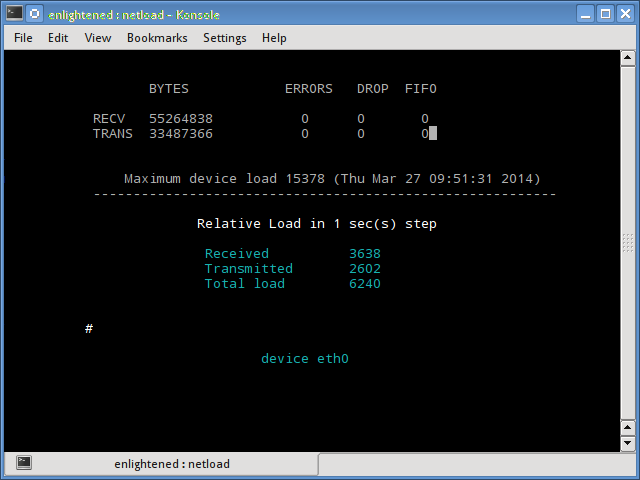
The netload command just displays a small report on the current traffic load, and the total number of bytes transferred since the program start. No more features are there. Its part of the netdiag.
ifstat
The ifstat reports the network bandwidth in a batch style mode. The output is in a format that is easy to log and parse using other programs or utilities.

dstat
Dstat is a versatile tool (written in python) that can monitor different system statistics and report them in a batch style mode or log the data to a csv or similar file. This example shows how to use dstat to report network bandwidth

collectl
Collectl reports system statistics in a style that is similar to dstat, and like dstat it is gathers statistics about various different system resources like cpu, memory, network etc. Over here is a simple example of how to use it to report network usage/bandwidth.

Summary
Those were a few handy commands to quickly check the network bandwidth on your linux server. However these need the user to login to the remote server over ssh. Alternatively web based monitoring tools can also be used for the same task.
Ntop and Darkstat are some of the basic web based network monitoring tools available for Linux. Beyond these lie the enterprise level monitoring tools likeNagios that provide a host of features to not just monitor a server but entire infrastructure.
Supplement
* Linux Network Statistics Tools / Commands
* iftop – finding traffic hogs
* How to install iftop?
* Install EPEL and additional repositories on CentOS and Red Hat
* CentOS 6.3 Instance Giving "Cannot retrieve metalink for repository: epel" Error
* iftop 流量監控使用教學,立刻抓出吃流量兇手
Network monitoring on Linux
This post mentions some linux command line tools that can be used to monitor the network usage. These tools monitor the traffic flowing through network interfaces and measure the speed at which data is currently being transferred. Incoming and outgoing traffic is shown separately.
Some of the commands, show the bandwidth used by individual processes. This makes it easy to detect a process that is overusing network bandwidth. The tools have different mechanisms of generating the traffic report. Some of the tools like nload read the "/proc/net/dev" file to get traffic stats, whereas some tools use the pcap library to capture all packets and then calculate the total size to estimate the traffic load.
Here is a list of the commands, sorted by their features.
Nload
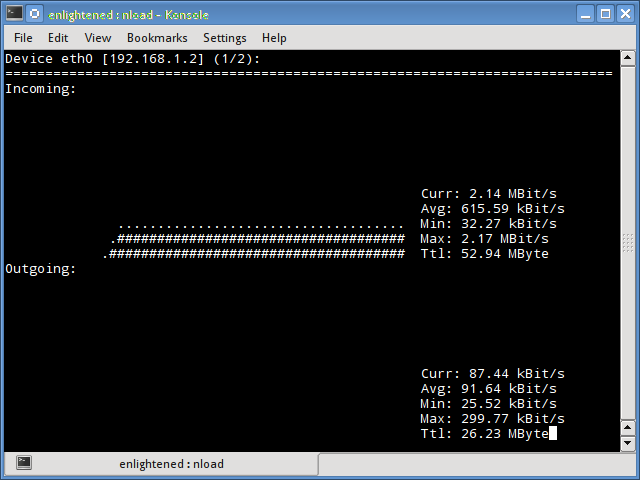
nload is a commandline tool that allows users to monitor the incoming and outgoing traffic separately. It also draws out a graph to indicate the same, the scale of which can be adjusted. Easy and simple to use, and does not support many options.
iftop
Iftop measures the data flowing through individual socket connections, and it works in a manner that is different from Nload. Iftop uses the pcap library to capture the packets moving in and out of the network adapter, and then sums up the size and count to find the total bandwidth under use.
Although iftop reports the bandwidth used by individual connections, it cannot report the process name/id involved in the particular socket connection. But being based on the pcap library, iftop is able to filter the traffic and report bandwidth usage over selected host connections as specified by the filter.
iptraf
Iptraf is an interactive and colorful IP Lan monitor. It shows individual connections and the amount of data flowing between the hosts. Here is a screenshot
nethogs
Nethogs is a small 'net top' tool that shows the bandwidth used by individual processes and sorts the list putting the most intensive processes on top. In the event of a sudden bandwidth spike, quickly open nethogs and find the process responsible. Nethogs reports the PID, user and the path of the program.
bmon
Bmon (Bandwidth Monitor) is a tool similar to nload that shows the traffic load over all the network interfaces on the system. The output also consists of a graph and a section with packet level details.
slurm
Slurm is 'yet' another network load monitor that shows device statistics along with an ascii graph. It supports 3 different styles of graphs each of which can be activated using the c, s and l keys. Simple in features, slurm does not display any further details about the network load.
tcptrack
Tcptrack is similar to iftop, and uses the pcap library to capture packets and calculate various statistics like the bandwidth used in each connection. It also supports the standard pcap filters that can be used to monitor specific connections.
Vnstat
Vnstat is bit different from most of the other tools. It actually runs a background service/daemon and keeps recording the size of data transfer all the time. Next it can be used to generate a report of the history of network usage.
Running vnstat without any options would simply show the total amount of data transfer that took place since the date the daemon is running.
To monitor the bandwidth usage in realtime, use the '-l' option (live mode). It would then show the total bandwidth used by incoming and outgoing data, but in a very precise manner without any internal details about host connections or processes.
Vnstat is more like a tool to get historic reports of how much bandwidth is used everyday or over the past month. It is not strictly a tool for monitoring the network in real time.
bwm-ng
Bwm-ng (Bandwidth Monitor Next Generation) is another very simple real time network load monitor that reports a summary of the speed at which data is being transferred in and out of all available network interfaces on the system.

cbm - Color Bandwidth Meter
A tiny little simple bandwidth monitor that displays the traffic volume through network interfaces. No further options, just the traffic stats are display and updated in realtime.
speedometer
Another small and simple tool that just draws out good looking graphs of incoming and outgoing traffic through a given interface.
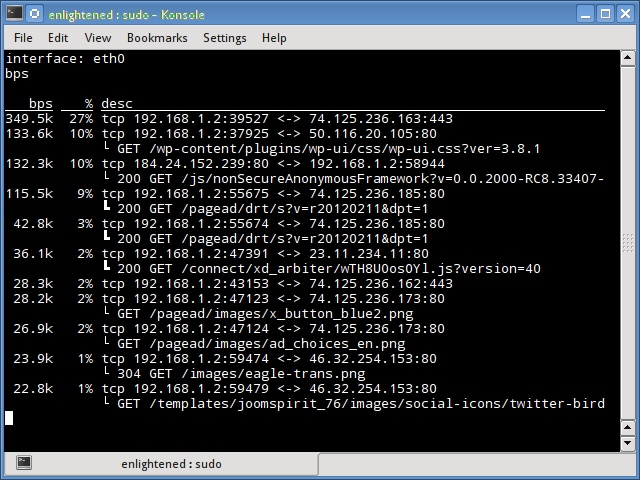
Pktstat
Pktstat displays all the active connections in real time, and the speed at which data is being transferred through them. It also displays the type of the connection, i.e. tcp or udp and also details about http requests if involved.
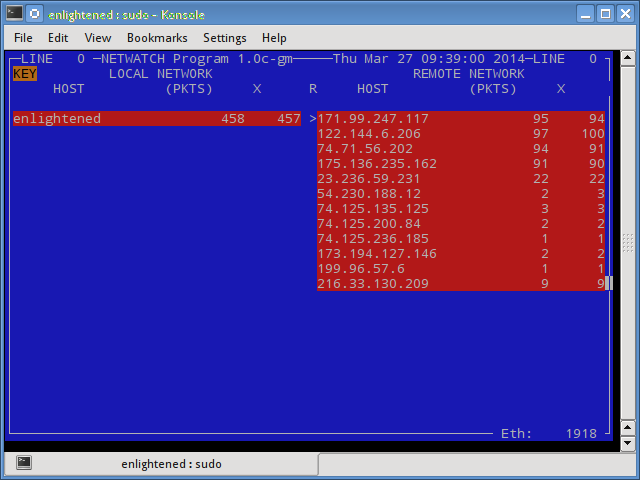
Netwatch
Netwatch is part of the netdiag collection of tools, and it too displays the connections between local host and other remote hosts, and the speed at which data is transferring on each connection.
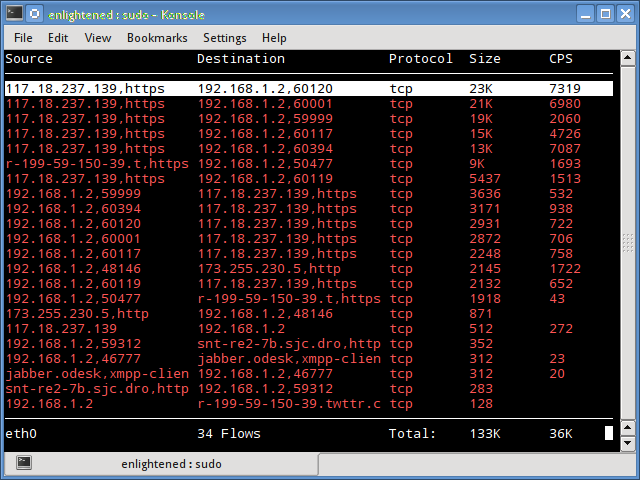
Trafshow
Like netwatch and pktstat, trafshow reports the current active connections, their protocol and the data transfer speed on each connection. It can filter out connections using pcap type filters. Monitor only tcp connections
Netload
The netload command just displays a small report on the current traffic load, and the total number of bytes transferred since the program start. No more features are there. Its part of the netdiag.
ifstat
The ifstat reports the network bandwidth in a batch style mode. The output is in a format that is easy to log and parse using other programs or utilities.
dstat
Dstat is a versatile tool (written in python) that can monitor different system statistics and report them in a batch style mode or log the data to a csv or similar file. This example shows how to use dstat to report network bandwidth
collectl
Collectl reports system statistics in a style that is similar to dstat, and like dstat it is gathers statistics about various different system resources like cpu, memory, network etc. Over here is a simple example of how to use it to report network usage/bandwidth.
Summary
Those were a few handy commands to quickly check the network bandwidth on your linux server. However these need the user to login to the remote server over ssh. Alternatively web based monitoring tools can also be used for the same task.
Ntop and Darkstat are some of the basic web based network monitoring tools available for Linux. Beyond these lie the enterprise level monitoring tools likeNagios that provide a host of features to not just monitor a server but entire infrastructure.
Supplement
* Linux Network Statistics Tools / Commands
* iftop – finding traffic hogs
* How to install iftop?
* Install EPEL and additional repositories on CentOS and Red Hat
* CentOS 6.3 Instance Giving "Cannot retrieve metalink for repository: epel" Error
* iftop 流量監控使用教學,立刻抓出吃流量兇手


